SD-WAN is a great enabler for many businesses, allowing them to improve the management of the infrastructure as well as improving user experience and application performance.
One thing I haven’t covered much in the series is performance and application visibility and how SteelConnect provides provides detailed insight. It allows filtering on user, location, application, uplink or device for example.
Disclaimer: I work for Riverbed, all views and expressions on this blog are entirely my own and don’t necessarily reflect the views of my employer.
The obvious location to start looking at these details is the Visibility header in SteelConnect Manager. There are a few options which are useful to track events or for troubleshooting links and/or VPN tunnels, however for this blog post I want to stick to the application visibility so we’ll dive into the Traffic Timeline option.
Here you see my home lab for example, with the data for today. The histogram at the top shows the amount of data per 15 minute block, and you can click on each block to check the usage in that time period.
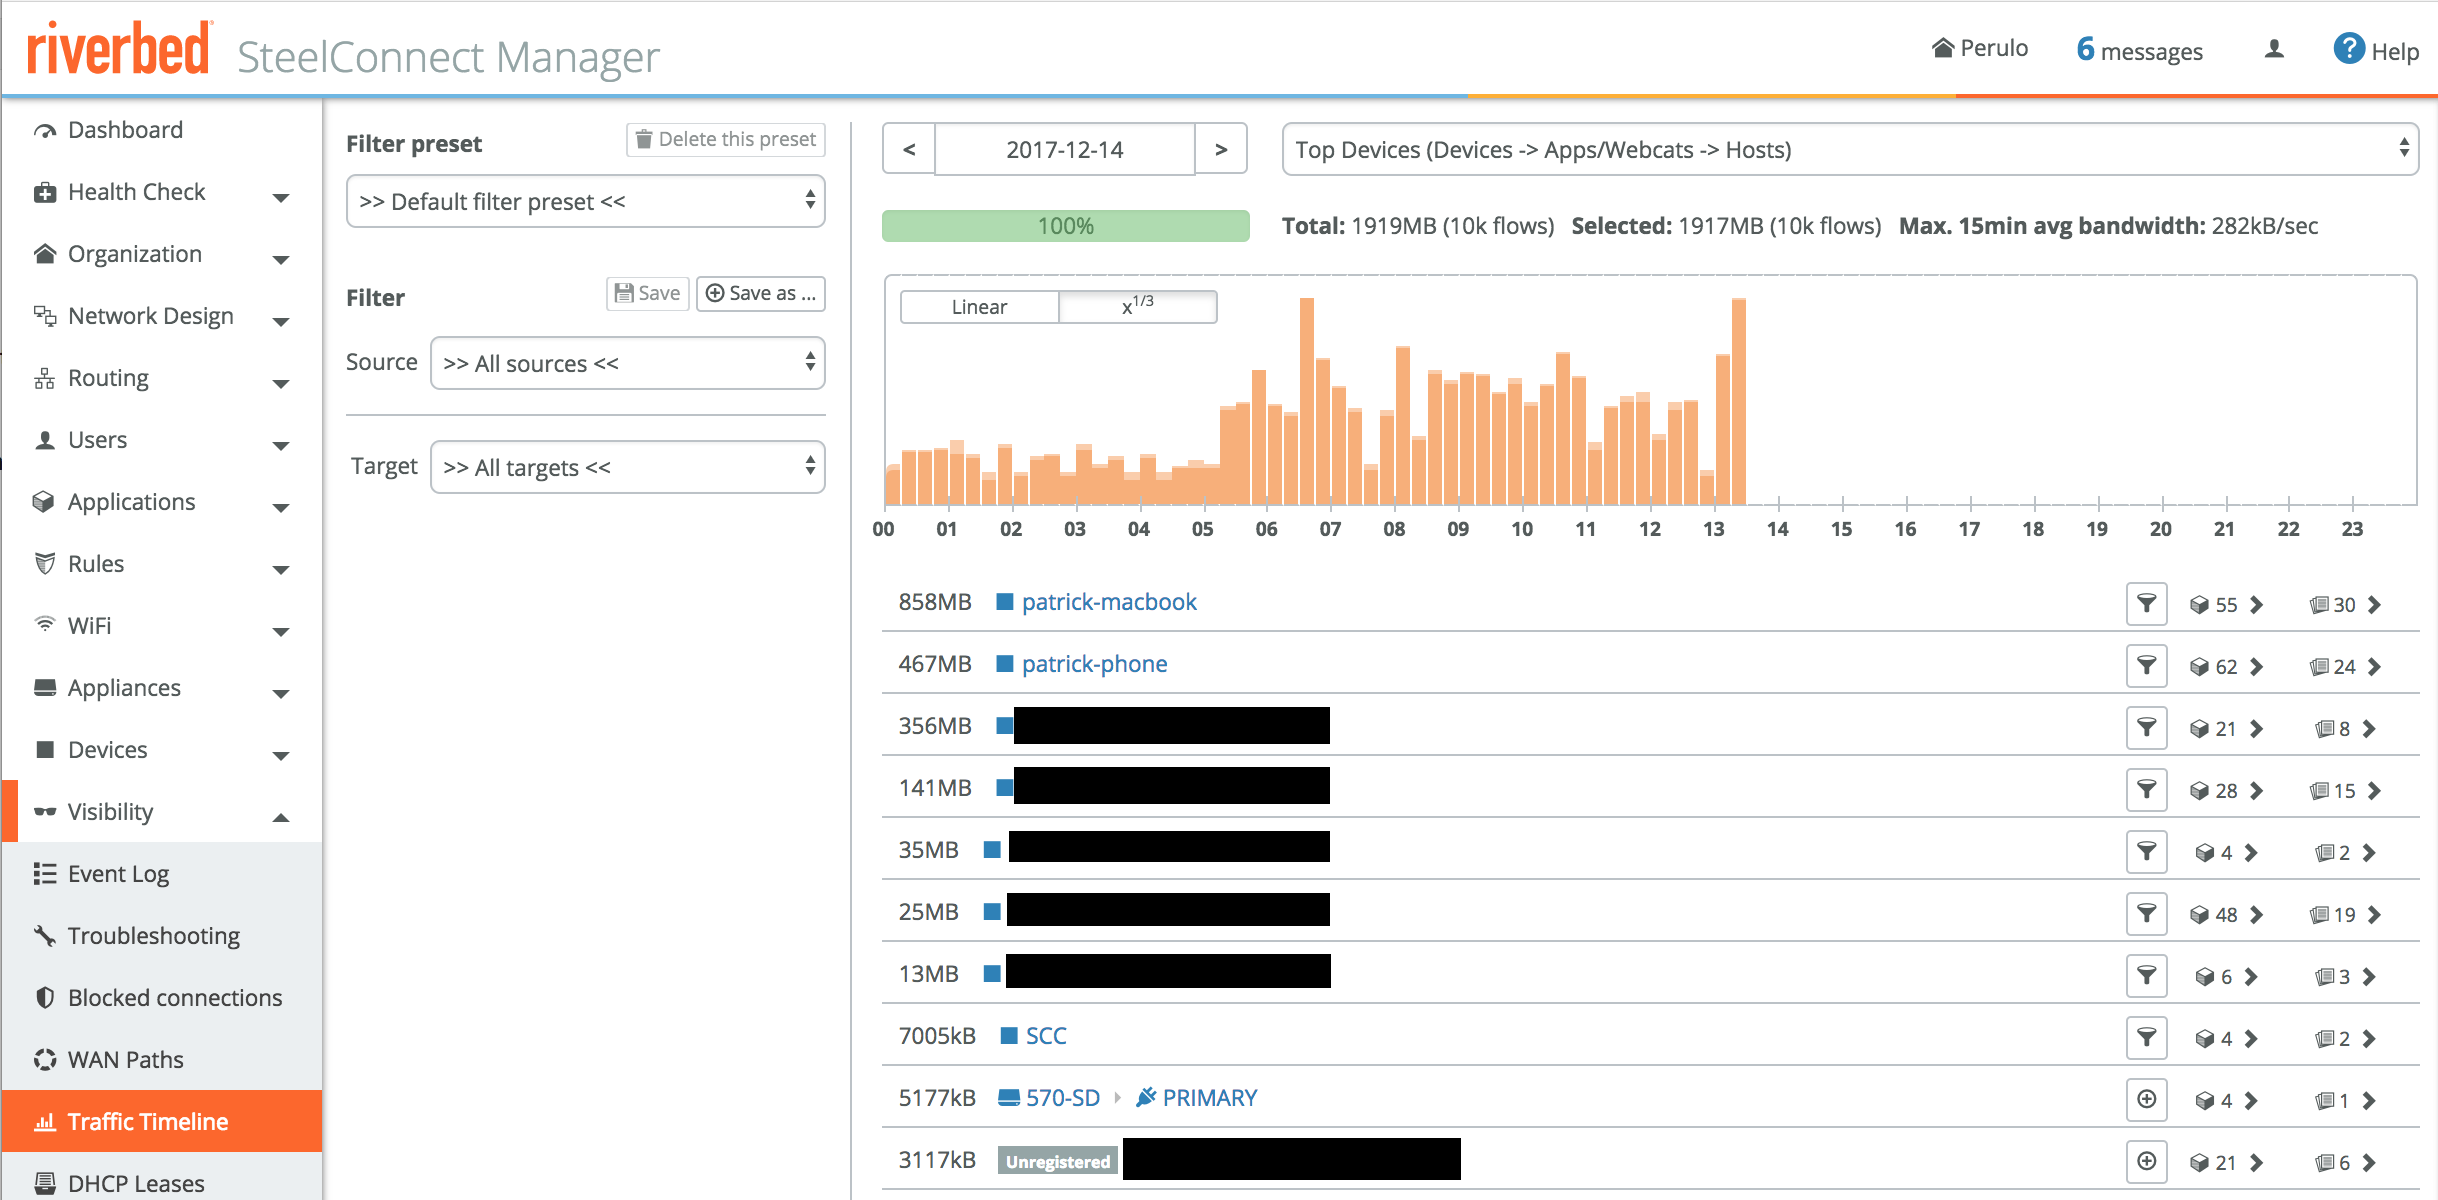

To see the traffic for a particular device, just click on that device. Looking at patrick-phone for example, once I click on the link with 62 (categories) on the right hand side, SCM shows it has detected the following categories for this device in this time period:
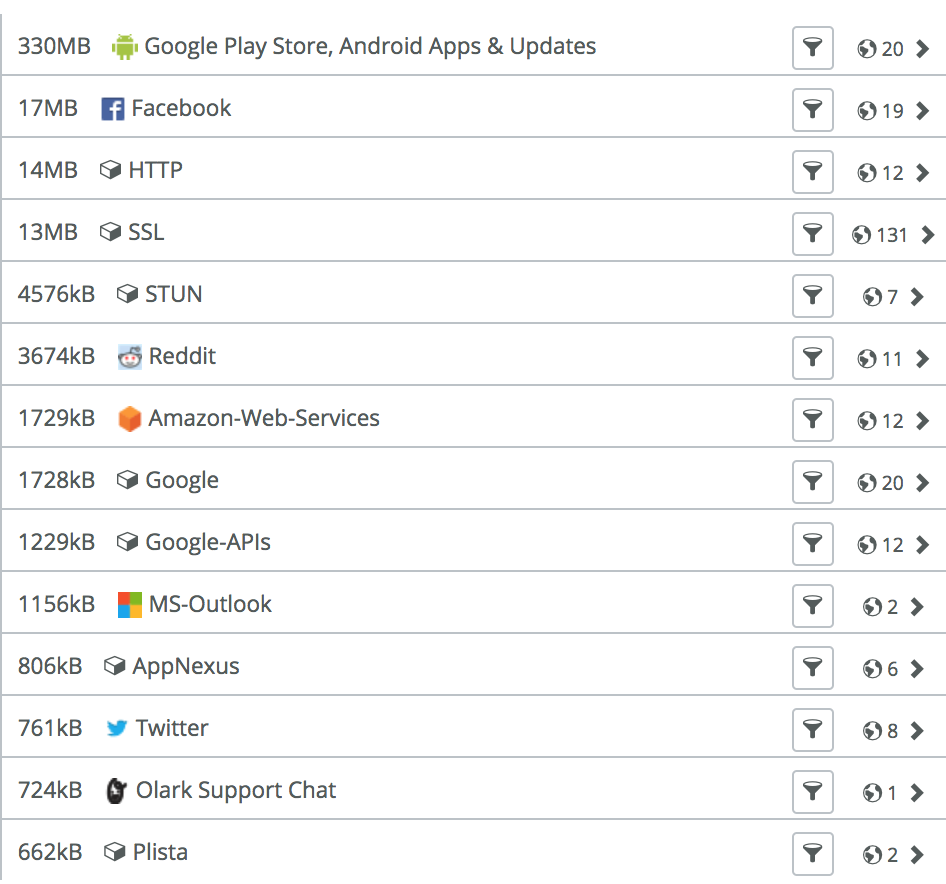

You can continue to analyse the specifics, this is a snippet of what is shown when clicking on the top one for example, telling you what URLs are part of that Google Play Store when I updated my apps this morning.


By clicking on the question mark SCM will do a WHOIS lookup to determine who owns the domain and where it’s located. Mostly useful for unknown domains, in case you have unknown destinations and you want to quickly check who owns it.
For all of the options above you can filter every step of the way, to quickly check what a user or device is doing, or what the most used applications are for a particular site. If you have custom applications created in SCM those will be shown and aggregated as well.
While the Traffic Timeline is a good starting point for insight, Riverbed has recently announced SteelCentral Insights for SteelConnect, a real mouthful. Sadly SCIfSC doesn’t make for a cool acronym, so I’ll just call it Insights moving forward to do you a favour.
For those not aware of Riverbed’s portfolio: our SteelCentral family contains Network Performance Management (NPM), Application Performance Management (APM) and end-user experience (EUE) solutions to allow companies to monitor, analyse and troubleshoot the infrastructure, application and user performance issues.
Insights enables performance monitoring and visibility for all applications, devices, sites and users in your SteelConnect Manager realm. With this information, you can make policy decisions, use it for monitoring or deployment decisions and of course troubleshoot performance issues. It’s based on NetProfiler, which is our Network Performance Management solution, and uses flows to receive the data.
Like SCM, it’s all cloud-based and cloud-managed. Oh, and it’s available at no cost to any SteelConnect customer! In case you wonder how it works: Insights gets the data from SCM securely using REST APIs and SteelFlow, which is based on NetFlow with a few additional Riverbed-specific metrics.
Once Insights is enabled for your realm, you’ll see an Insight button appear in various parts of SteelConnect Manager which will take you to the relevant part of the Insights GUI.
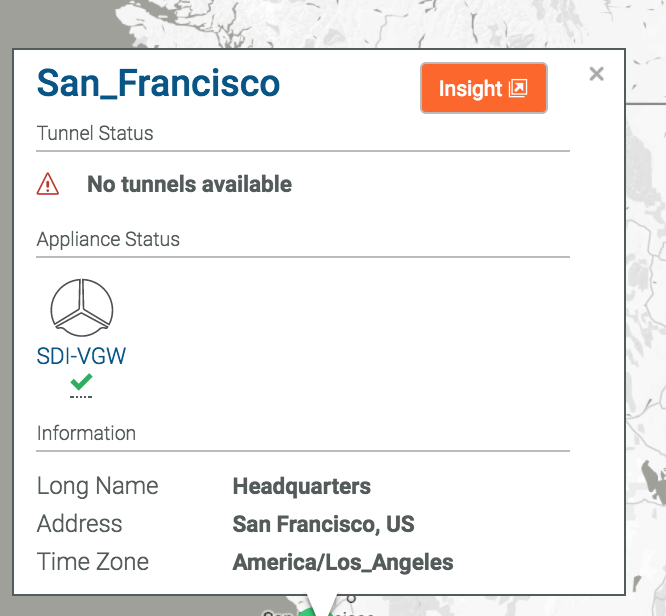

Because we specifically clicked on San Francisco, it’ll take us to the Insights GUI and straight into the San Francisco site summary. We can see what’s happening for that site, what the top applications, links and interactions are for that site. The system shown is a lab system with limited data, but you get the gist. Click to enlarge.
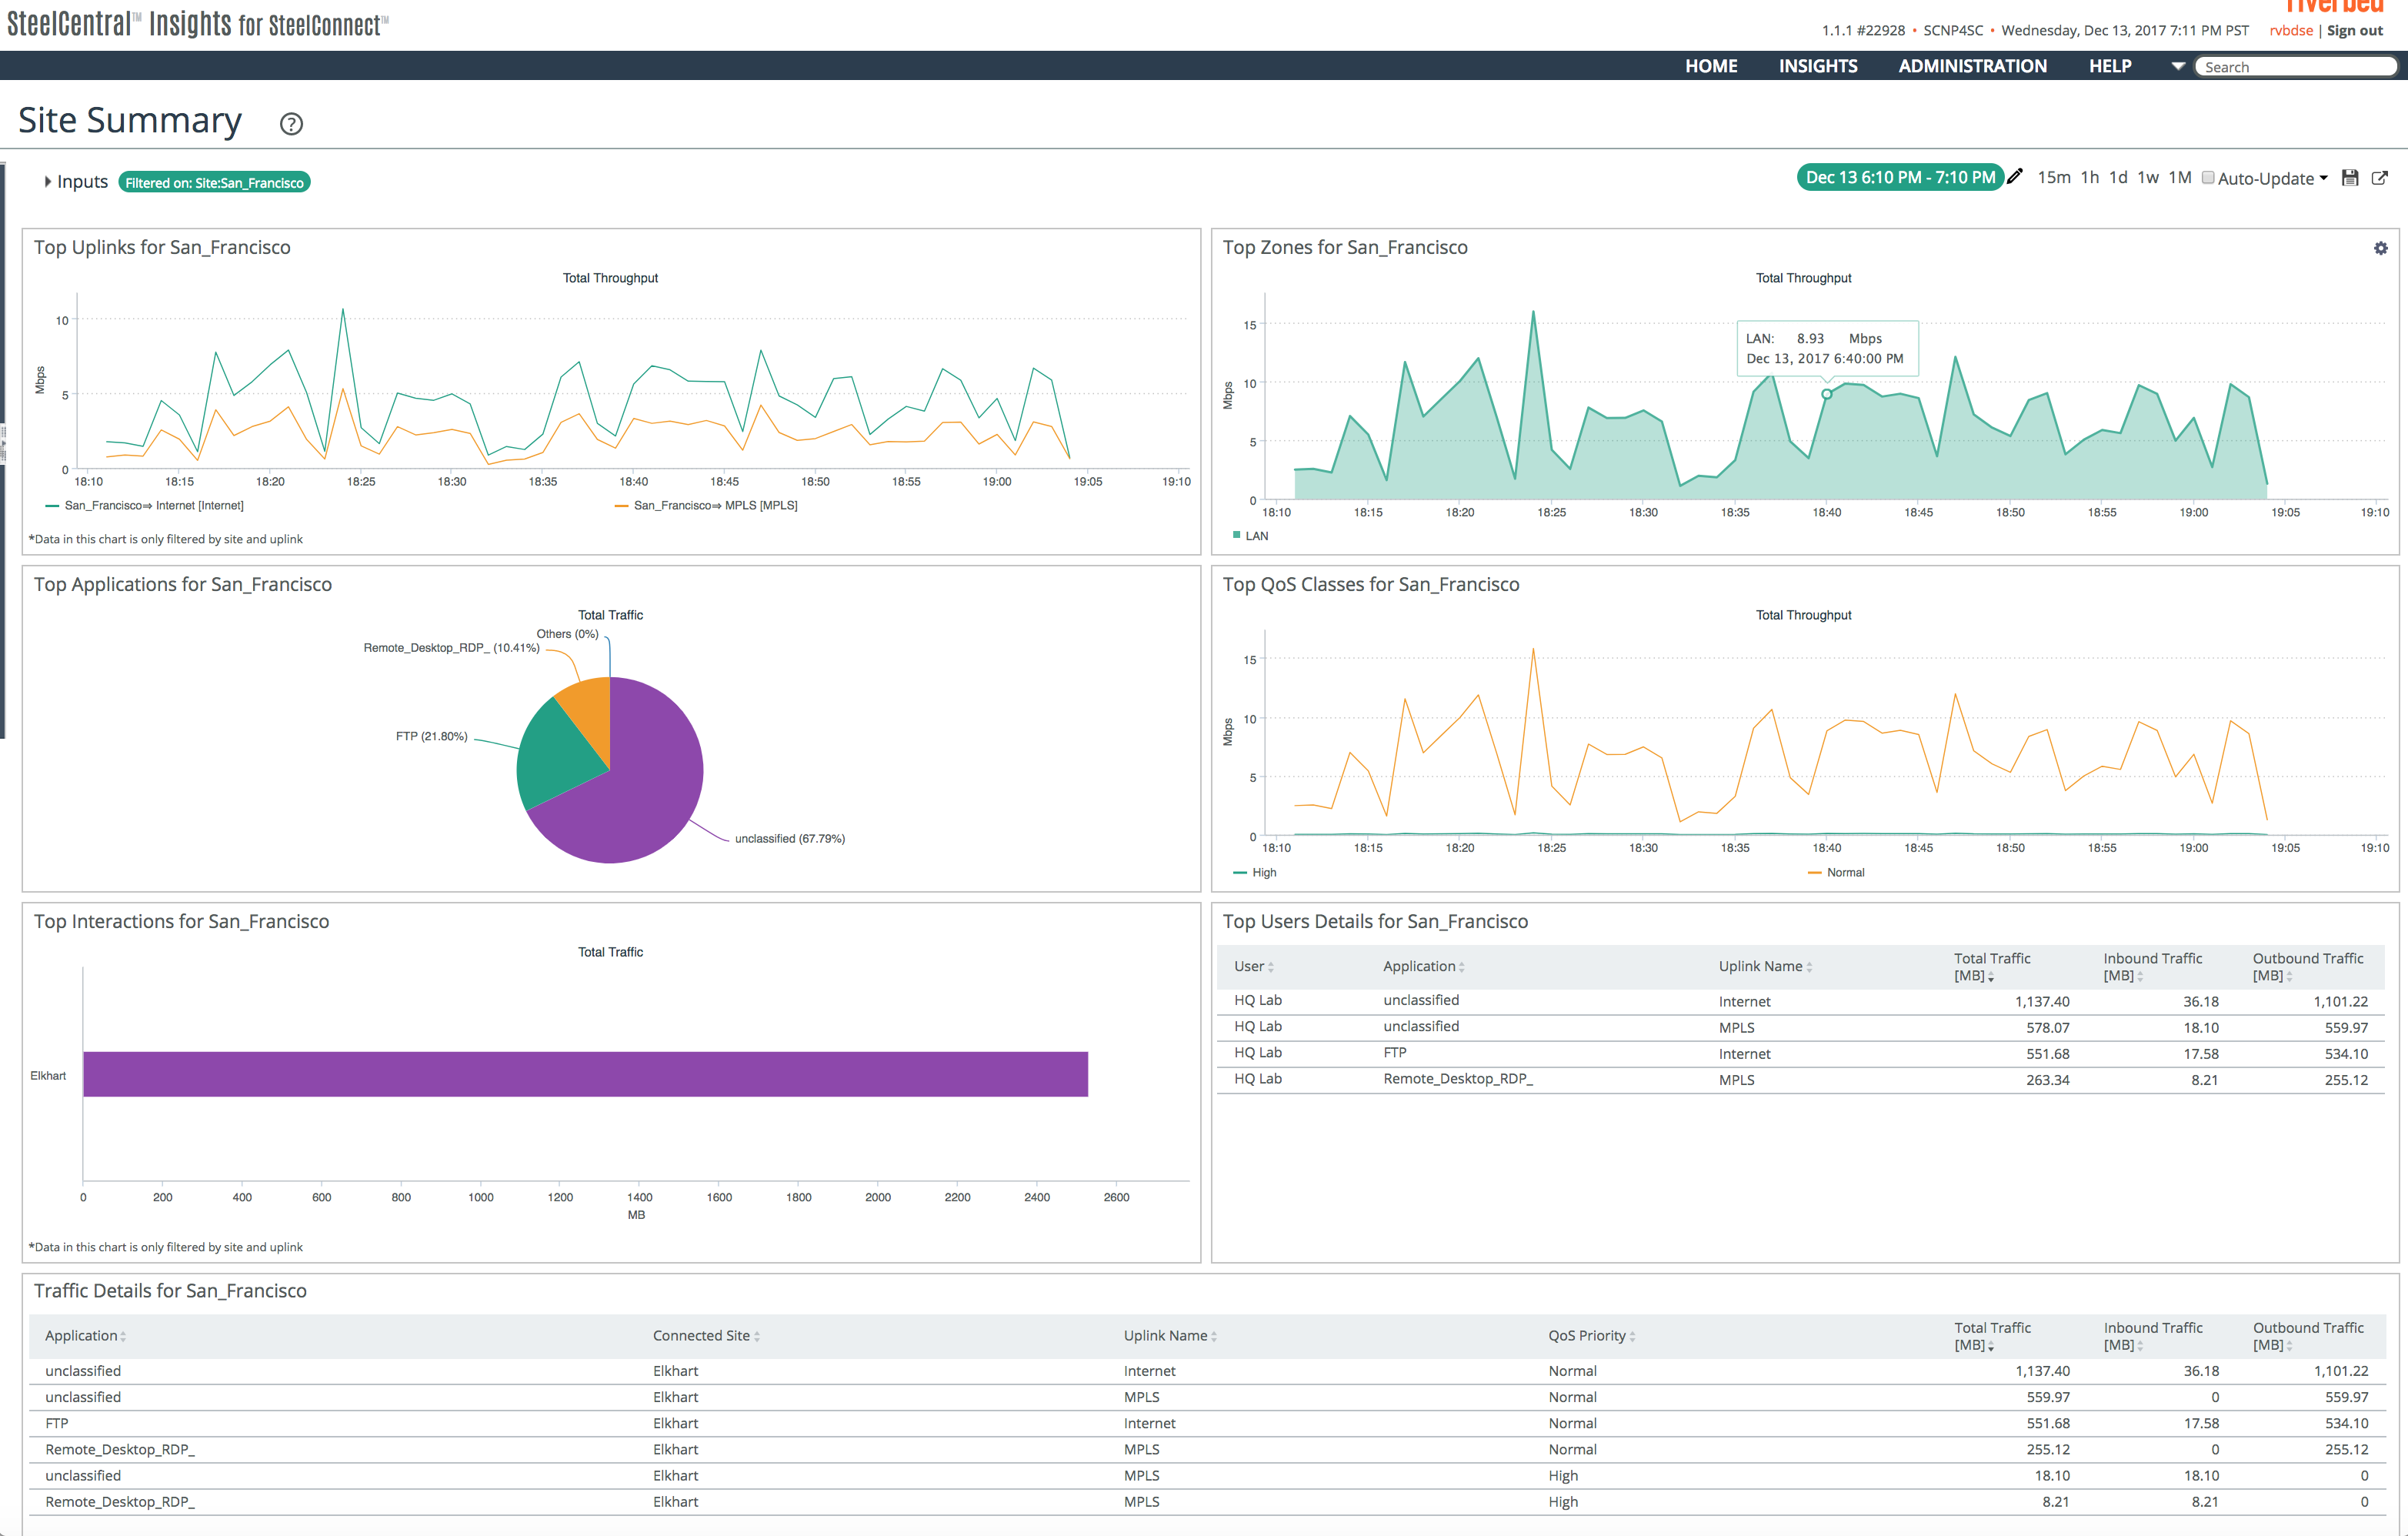

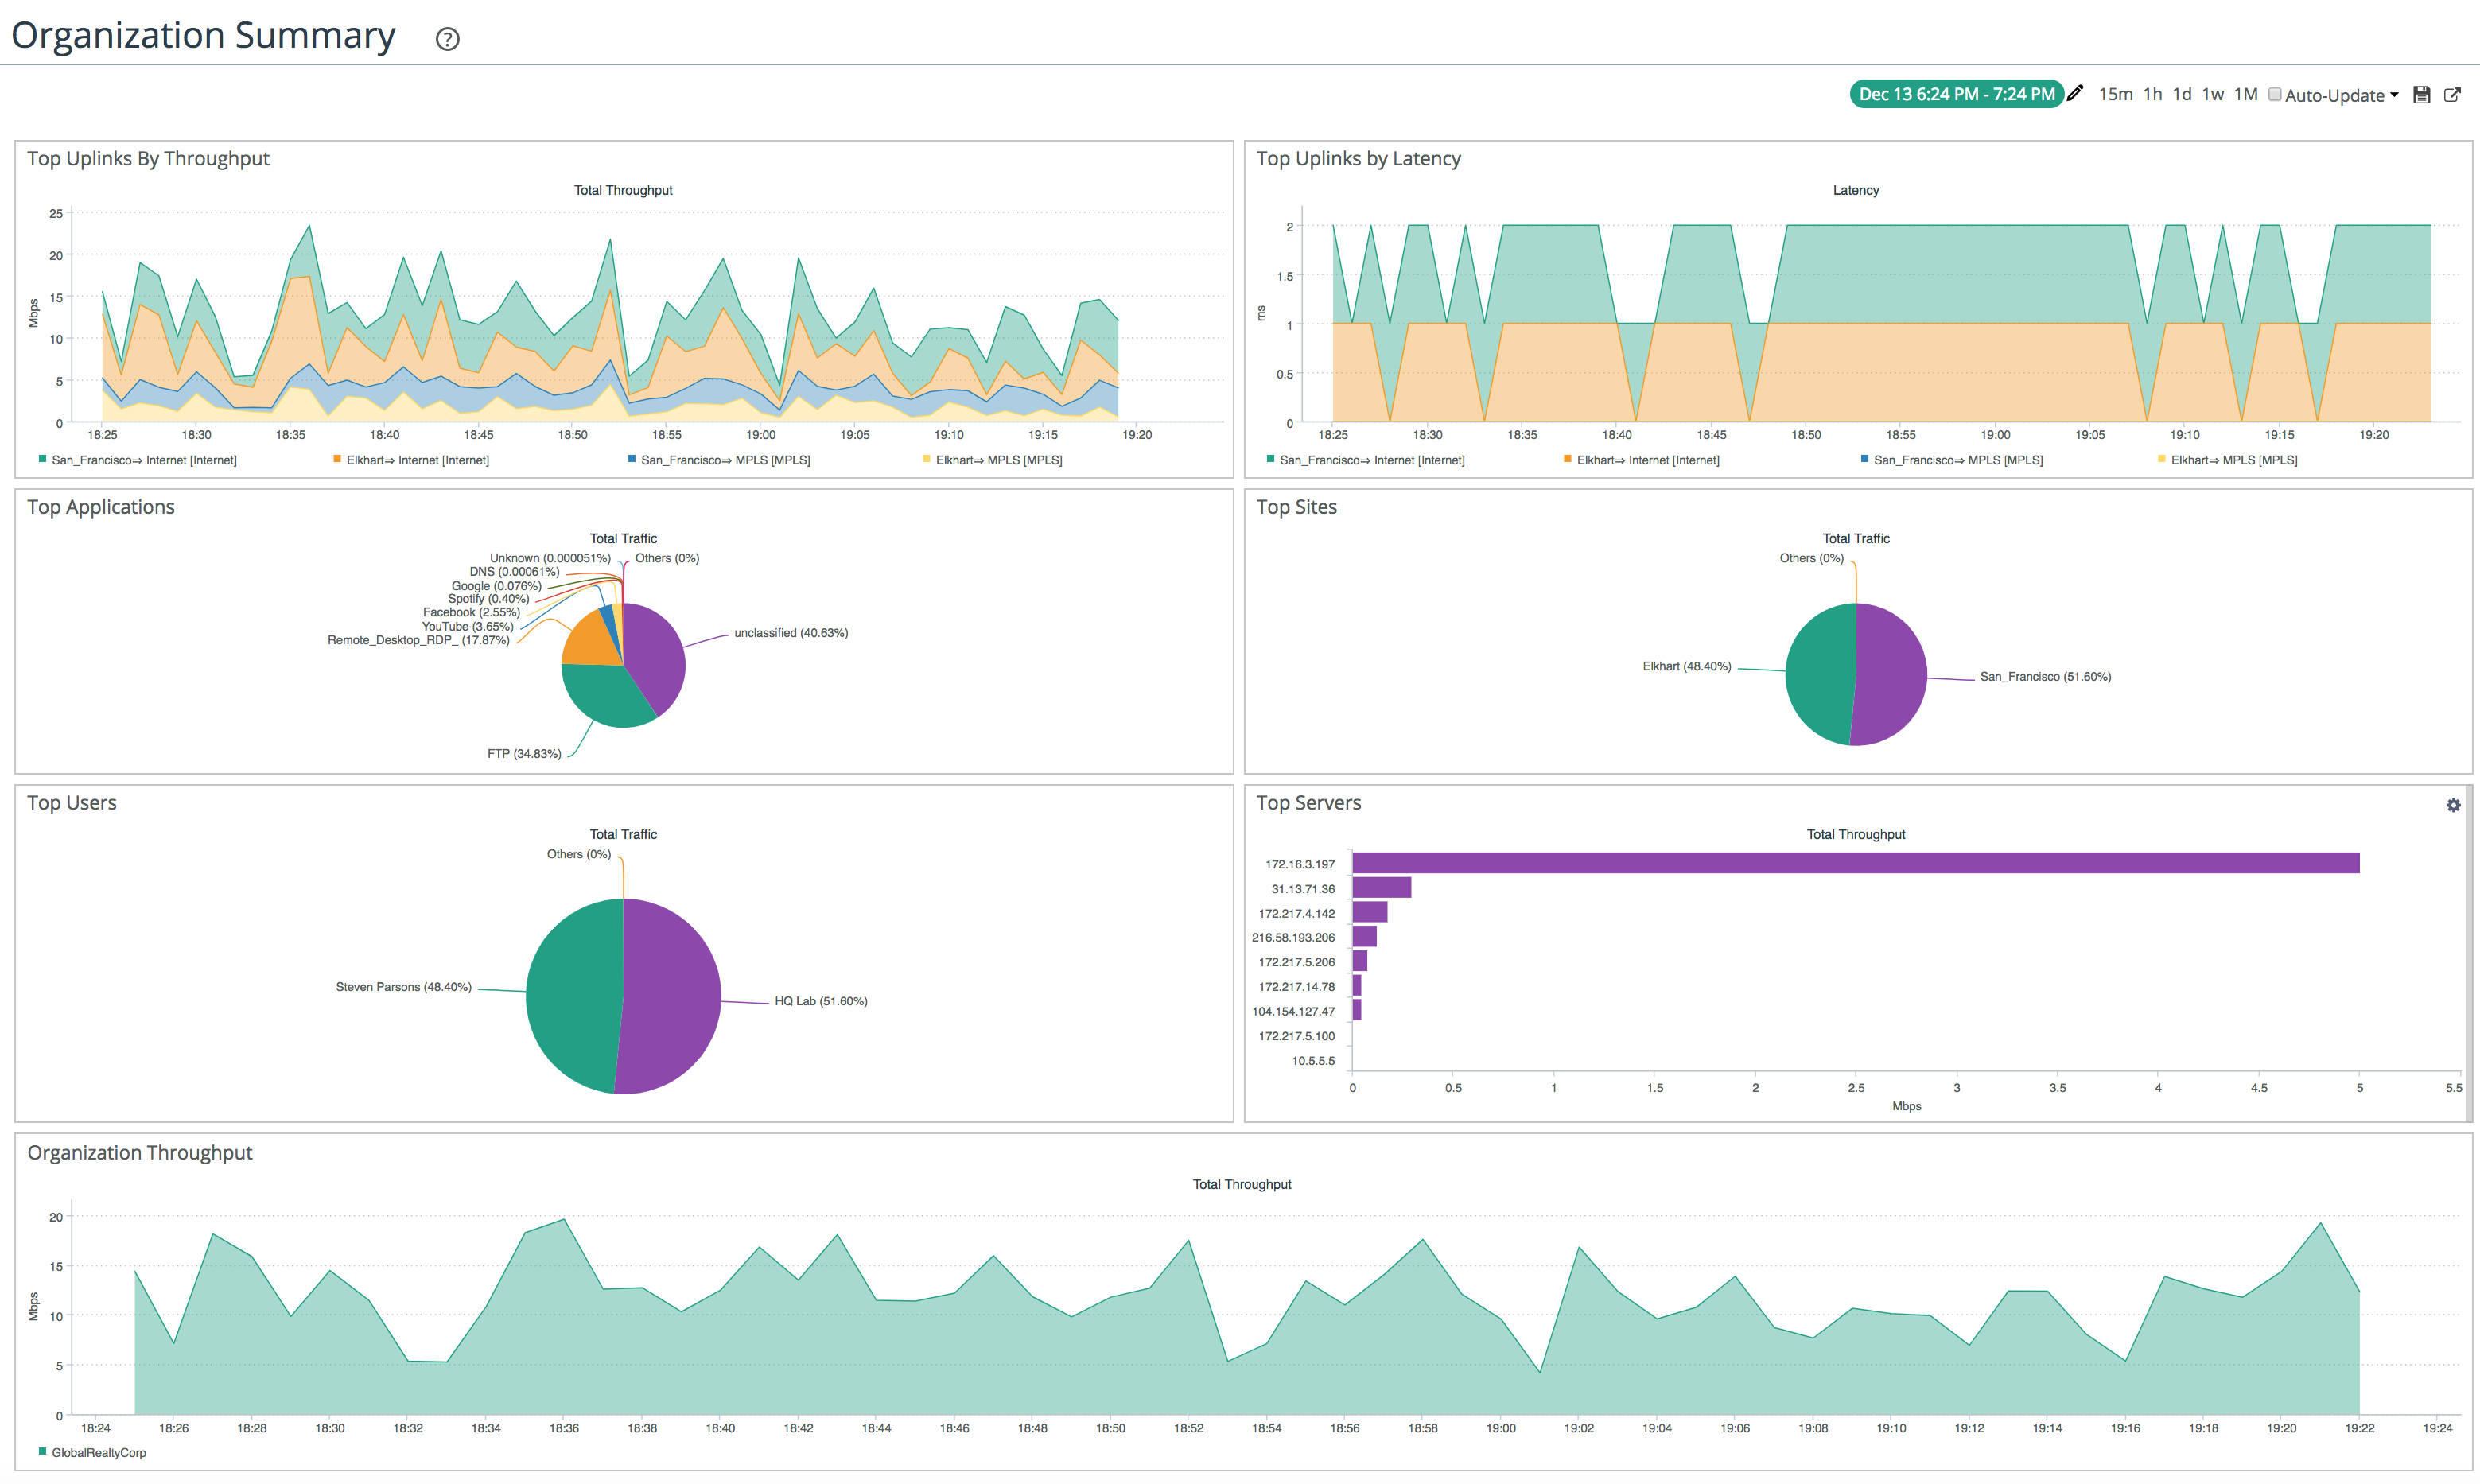
Besides being able to see what’s happening on a site-level, we can also inspect and analyse how an application, user or how the organisation as a whole is performing.
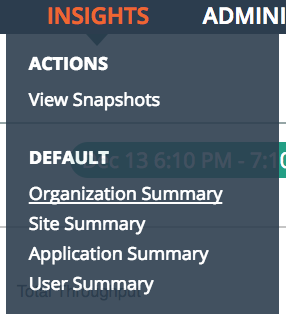

As you would expect, the appearance and widgets on the dashboard can be fully customised, so the dashboard below is just an example of what the organisation summary looks like, keep in mind there’s limited data in this lab system.

If you are a current SteelConnect customer, have a chat to your account team to have Insights enabled for your realm.
If you want to test SteelConnect, head here for a free trial.
The complete series:
Part 1: SD-WAN for the masses
Part 2: Getting started with SteelConnect
Part 3: Native Amazon AWS & Microsoft Azure integration
Part 4: Intelligent traffic steering
Part 5: SD-LAN
Part 6: Application visibility
Part 7: REST API
Part 8: SteelHead integration
