
Observability is a hot topic for many customers I talk to nowadays so I wanted to setup a simple and cost-effective lab environment for training and customer demos. It would have to be a publicly available web application stack, one that would be easy to replicate and the ability to stand it and tear it down up in minutes automatically.
Breaking it down, it would require the following at a high level:
- Provision the infrastructure in a cloud provider.
- Install the right software stack.
- Sends metrics and traces to an APM solution for analysis and alerting.
- World domination. Ok, maybe not quite that.
For the provisioning I decided to use Terraform, with the infrastructure being hosted in AWS. For compute I could’ve used EC2 instances but AWS Spot Instances are a fraction of the cost and good enough for my non-critical use case.
The software stack that’s to be installed consists of Kubernetes, in the form of the lightweight K3s. On top of that the Jaeger Hot R.O.D. microservices demo application will be deployed to simulate a simple application stack that we can monitor.
For sending metrics, traces and logs the using Splunk’s Infrastructure Monitoring Smart Agent will be deployed in another container. This was formerly known as the SignalFx Smart Agent, it was rebranded earlier this year. These metrics and traces can then be analysed and alerted on in Splunk Infrastructure Monitoring in real-time. There’s a 14-day free trial you can use in case you want to get started with this, all that we then need to capture is the access token and the realm that your organisation is part of.
Last but not least we’ll setup Dynamic DNS using DuckDNS to make it easy to access the URL instead of having to figure out the IP or Amazon DNS name, all we need for this is a DuckDNS account and a token.
So let’s jump in! This blog assumes you have an AWS account and an access key and secret in order to get started. Other things you’ll need in case you want to set this up yourself:
- Terraform
- AWS CLI
To get started, configure your AWS credentials and preferred region if you haven’t done so with aws configure:
AWS Access Key ID [****************1234]:
AWS Secret Access Key [****************abcd]:
Default region name [us-west-1]:
Default output format [text]:
We don’t want to set token values in text files, so make sure to also add environment variables for the token used for Splunk SIM as well as for DuckDNS, with the TF_VAR prefix so Terraform can use them. In my case I’ll add them to my profile in ~/.zshrc:
export TF_VAR_duckdns_token=xxx-xxx-xxx-xxx-xxx
export TF_VAR_splunk_sim_token=xxxx
For these to be available straight away, use source ~/.zshrc after you saved the file. Now onto the actual Terraform files and files, which you can find in my Bitbucket repo:
- variables.tf declares all the variables we’ll use, including the filter to retrieve the latest Amazon Linux 2 AMI image as well as pointing to the template file we’ll use for cloud-init k3s.yaml.
- k3s.tf is the main Terraform file, more on that below.
- k3s.yaml contains the bash script that we’ll use for cloud-init, to bootstrap the Spot Instance we’re deploying.
- values.yaml is used for configuring the Infrastructure Monitoring agent, where we set the environment via a variable.
When looking at the k3s.tf file, the most important parts are:
resource "aws_security_group" "sg_k3s_hotrod"will create a security group sg_k3s_hotrod which allows incoming TCP traffic on port 8080 and 22 for web and SSH respectively, as well as allowing all outbound traffic.resource "aws_spot_instance_request" "aws_linux"will create the AWS Spot Instance request, requesting the latest version of the Amazon Linux 2 instance as specified in thevariables.tffile. Thewait_for_fulfillment = trueline ensures that Terraform waits till the Spot Request has been successfully fulfilled and there’s an instance that it can connect to. Theuser_data = data.template_file.user_data.renderedreferences the template file that’s set in variables.tf, which in our case is k3s.yaml, our cloud-init bash script.- The
outputfields at the bottom of the file will write the instance ID, public IP and the SSH string to the console, helping us to connect to the instance quickly once it’s provisioned.
The actual configuration of the server itself is done using the cloud-init bootstrap script in k3s.yaml. The file is heavily commented so it should be easy to follow, the most important part is by default commands are run as the root user, which doesn’t work for all commands. So some commands are specifically ran as the ec2-user, most importantly the one that uses Helm to install the Splunk IM Smart Agent.
The file starts with enabling SSH password authentication, remove these lines or set them to ‘no’ if you don’t want this and only allow private key authentication.
ssh_pwauth: yes
password: xxx
Going through the file you’ll see it uses quite a few variables during install, most important are the splunk_sim_token and splunk_sim_realm one, which are the Splunk Infrastructure Monitoring access token and realm respectively. The documentation on all options can be found on signalfx.com.
  - |
    su - ec2-user -c "
    helm install \
    --set signalFxAccessToken=${splunk_sim_token} \
    --set environment=${environment} \
    --set clusterName=${user}-k3s-cluster \
    --set hostname=${user}-k3s-node1 \
    --set intervalSeconds=1 \
    --set kubeletAPI.url=https://localhost:10250 \
    --set signalFxRealm=${splunk_sim_realm} \
    --set traceEndpointUrl=https://ingest.${splunk_sim_realm}.signalfx.com/v2/trace \
    --set gatherDockerMetrics=false \
    signalfx-agent signalfx/signalfx-agent \
    -f /home/ec2-user/values.yaml"
Once that is done, we install the Hot ROD microservices application, get the IP address of the container and create a urls.txt file with all the endpoints from the application. The last URL with customer ID 999 does not exist and will generate an error, so we should see errors pop up in our APM solution. To do the load testing and get some data we then run siege to randomly hit these URLs for 4 hours.
# Install Hot ROD, using the YAML from SignalFx's Observability Workshop.
  - su - ec2-user -c "kubectl apply -f https://raw.githubusercontent.com/signalfx/observability-workshop/master/apm/hotrod/k8s/deployment.yaml"
  # Get the IP address of the Hot ROD container, save in HOTROD_ENDPOINT env variable
  - HOTROD_ENDPOINT=$(kubectl get svc hotrod -n default -o jsonpath='{.spec.clusterIP}:{.spec.ports[0].port}')
  # Create urls.txt with the different URLs that the Hot ROD app is using.
  - |
    echo \
    "http://$HOTROD_ENDPOINT/dispatch?customer=392
    http://$HOTROD_ENDPOINT/dispatch?customer=123
    http://$HOTROD_ENDPOINT/dispatch?customer=568
    http://$HOTROD_ENDPOINT/dispatch?customer=731
    http://$HOTROD_ENDPOINT/dispatch?customer=999" > /home/ec2-user/urls.txt
  # Then start siege in the background to use this file to hit these URLs in random order (-i), for a time period of 4 hours (-t4H).
  - nohup siege -i -f /home/ec2-user/urls.txt -t4H &
To execute our Terraform plan, run terraform init in the directory where you downloaded these files.
Once that’s done, run terraform apply in order review and execute the plan and deploy the instance. If you don’t specify the variables, Terraform will ask you for all the variables.
To avoid this, you can create a terraform.tfvars file, containing the following variables. Modify them as required:
aws_profile = "default"
aws_region = "us-west-1"
duckdns_domain = "xxx.duckdns.org"
environment = "xxx"
key_name = "terraform"
private_key_path = "/Users/xxx/.ssh/your_private_key"
prod_instance_type = "t3a.medium"
public_key_path = "/Users/xxx/.ssh/your_private_key.pub"
splunk_sim_realm = "us0"
user = "xxx"
Once you run terraform apply and it executes successfully you should see something similar to this:
aws_key_pair.ec2: Creating...
aws_security_group.sg_k3s_hotrod: Creating...
aws_key_pair.ec2: Creation complete after 2s [id=terraform]
aws_security_group.sg_k3s_hotrod: Creation complete after 8s [id=sg-0000aaaabbbbbeeee]
aws_spot_instance_request.aws_linux: Creating...
aws_spot_instance_request.aws_linux: Still creating... [10s elapsed]
aws_spot_instance_request.aws_linux: Creation complete after 16s [id=sir-ms3ie43g]

Apply complete! Resources: 3 added, 0 changed, 0 destroyed.

Outputs:

instance_id = "i-04a1234abcde12345"
public_ip = "x.x.x.x"
ssh_login = "ssh ec2-user@x.x.x.x -i /Users/ppeeters/.ssh/terraform_id_rsa"
Once you then login using the ssh_login string above, you can check the output of the cloud-init script using cat /var/log/cloud-init-output.log.
To check that our containers deployed successfully, we can run kubectl get pods, which should show a signalfx-agent container as well as two containers for the hotrod application.
[ec2-user@ip-172-31-3-213 ~]$ kubectl get pods
NAME                      READY   STATUS    RESTARTS   AGE
svclb-hotrod-zjcqt        1/1     Running   0          86s
hotrod-64794bb87d-x2f74   1/1     Running   0          85s
signalfx-agent-sx4t2      1/1     Running   0          86s
Great, now let’s check Splunk Infrastructure Monitoring if the data is coming in. This post is not an extensive guide on Splunk Infrastructure Monitoring or APM, I might save that for a future post but if you signed up for the free trial you should be able to follow along and I encourage you to explore this in more detail.
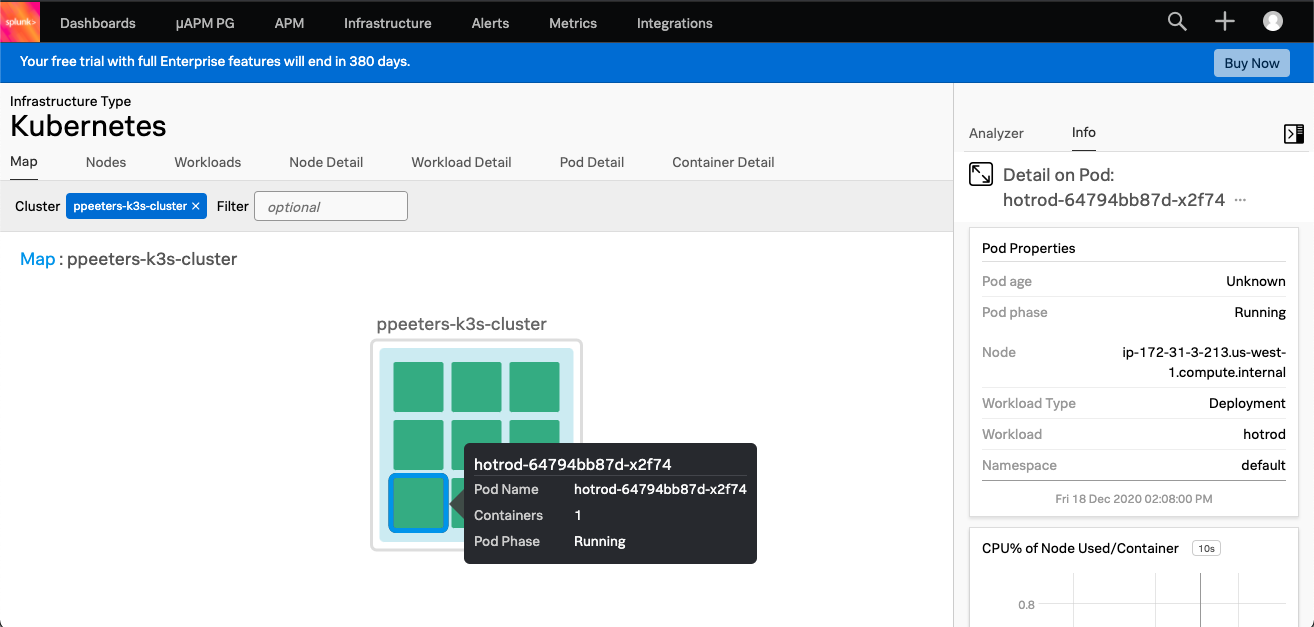
Go to Infrastructure -> Kubernetes Navigator -> Cluster Map and you’ll see all Kubernetes clusters that are reporting their metrics. Click or filter on the one that you specified, if you used the default settings it’ll be username-k3s-cluster. If you don’t see data, check that the agent is running and your username is set correctly.
You should see something like this, showing the pod details and the detected containers. Click on the tabs to can explore the host/workload/pod details at your own leisure, it’s out of scope for this blog post. By default the Smart Agent sends data every 10 seconds so you should see updates quite quickly.
If you’re wondering how the Hot ROD app works, this blog post is an awesome read. To check our Hot ROD application, let’s go to the APM tab. As a reminder the siege application is doing some very basic load testing, with 1 out of 5 URLs being invalid due to a non-existent customer ID (999).
Once you filter on your environment (default is username-dev) you’ll see the Hot ROD application, and the services that are part of that application. As you would expect, red is not good and there’s plenty there so let’s look at this in more details.
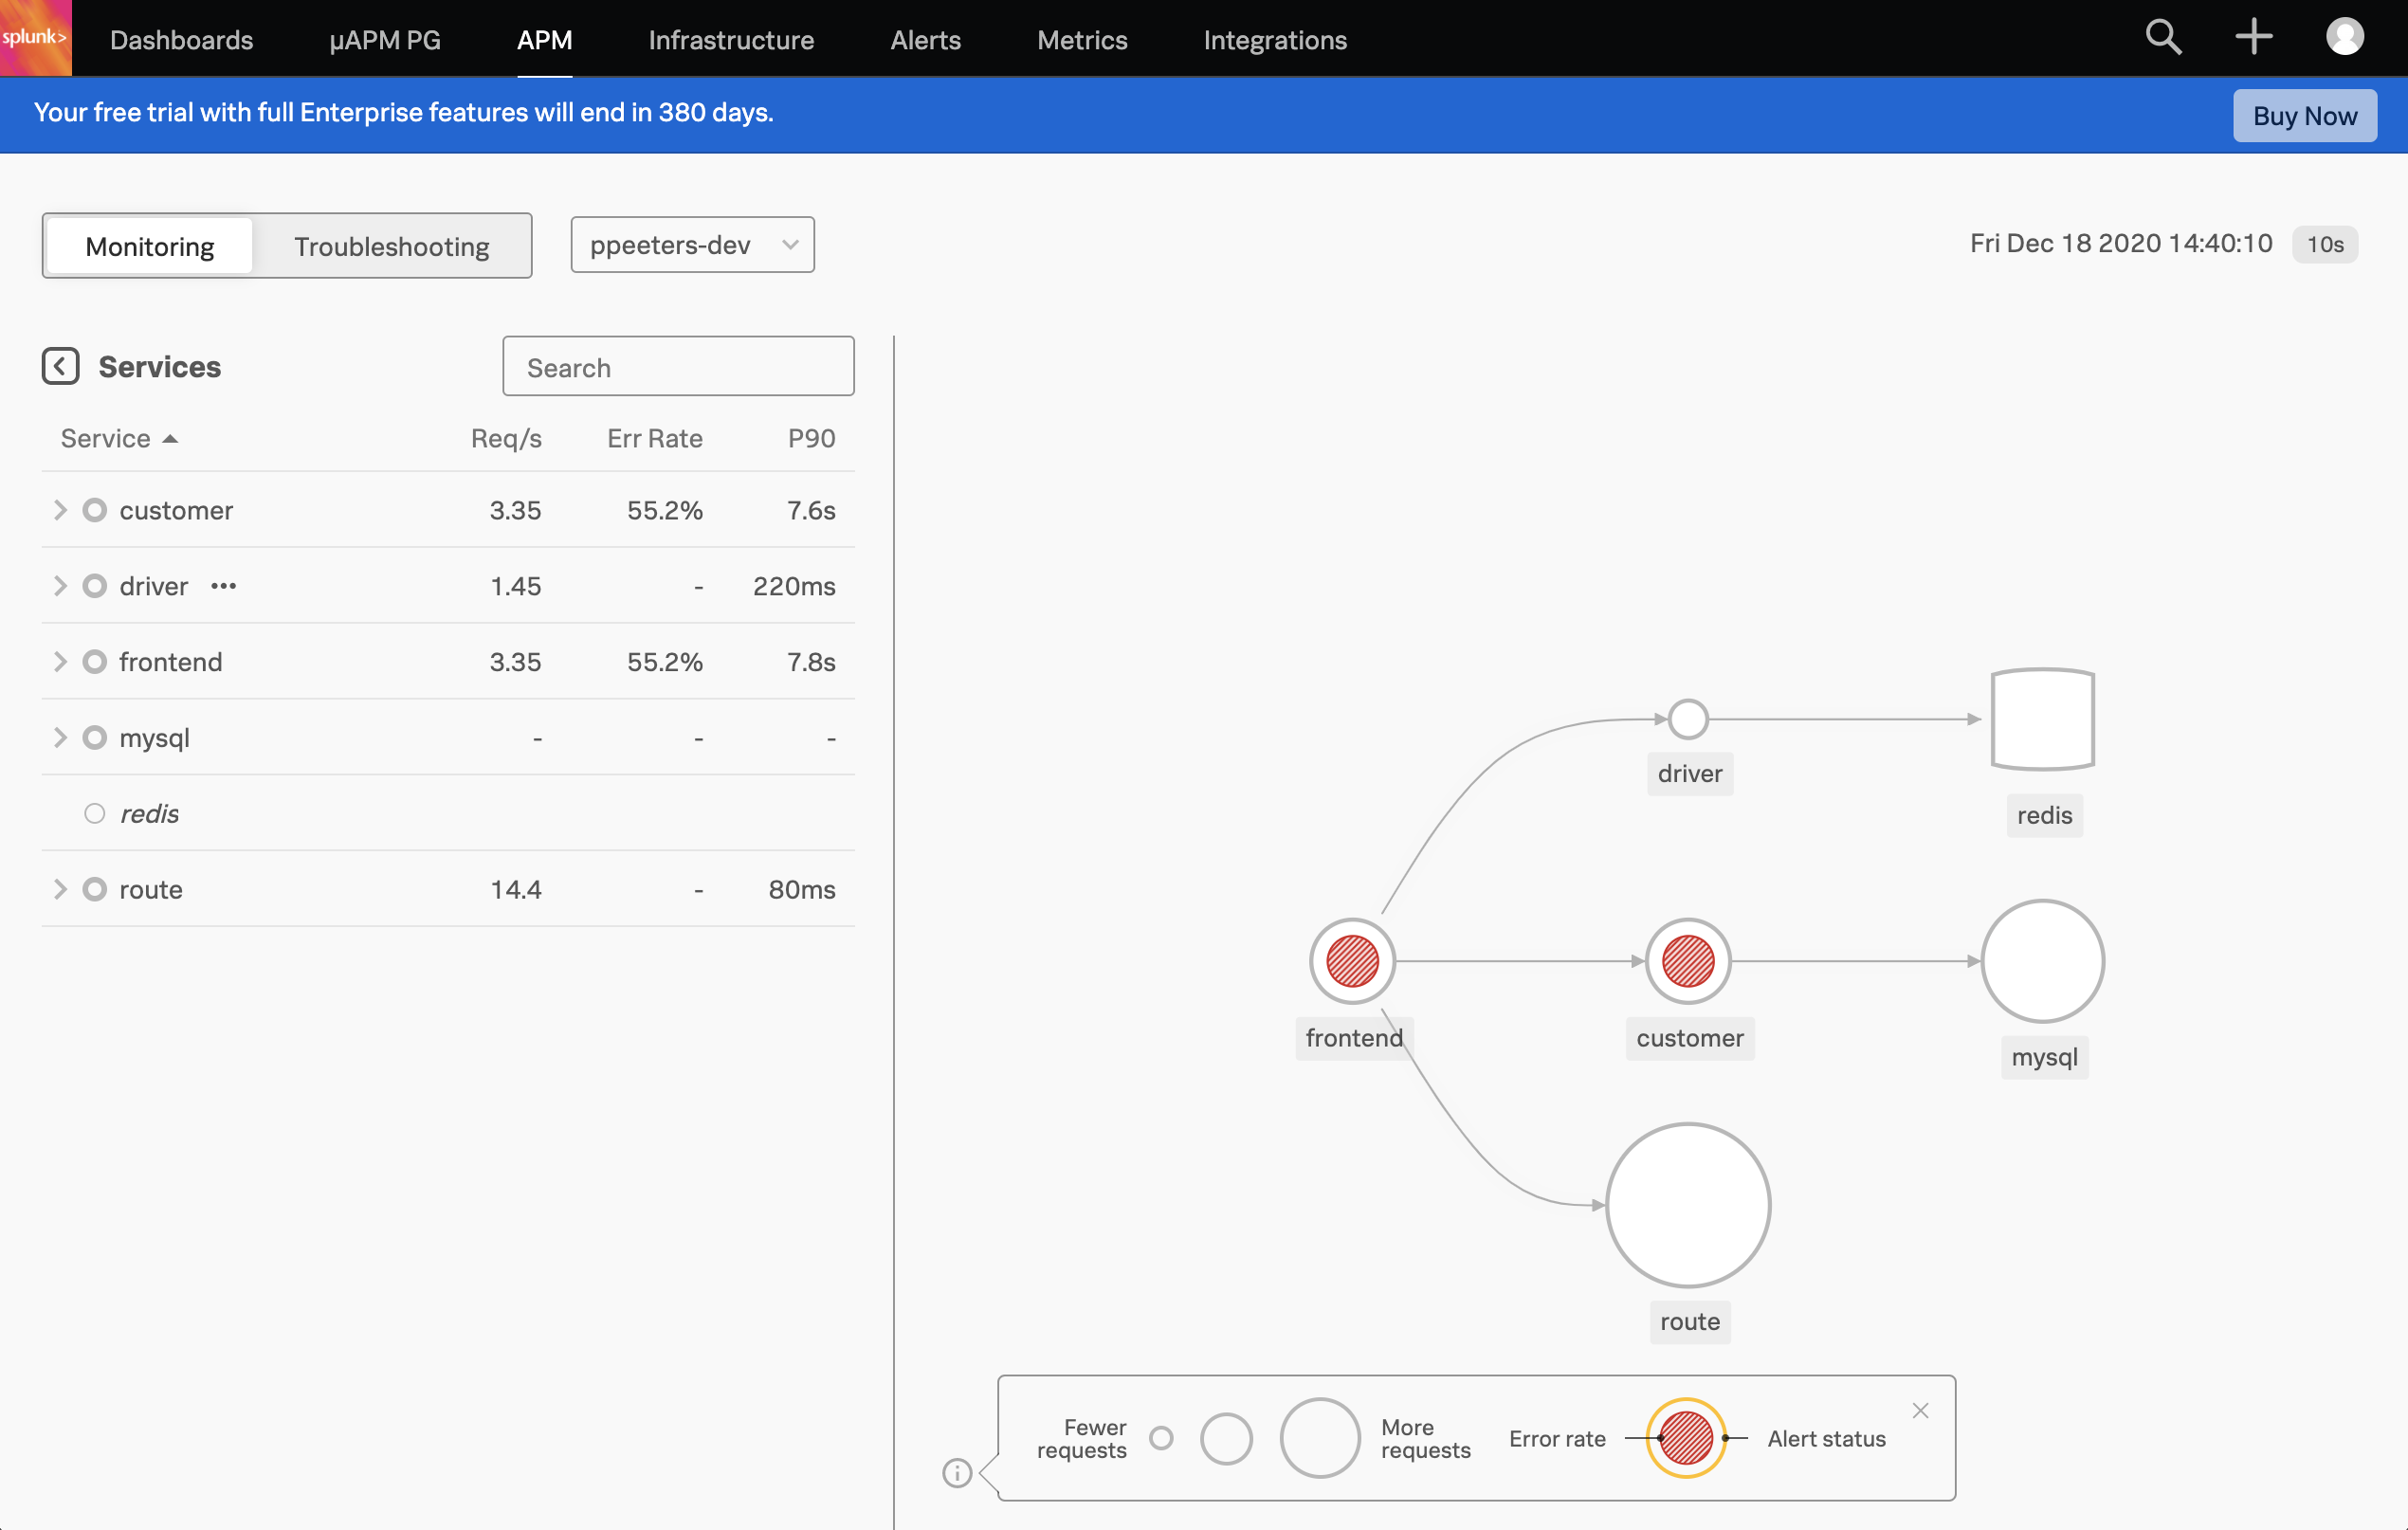
There are a few ways we can tackle this, but let’s start at a high-level and click on the Troubleshooting tab, this will show all services. You can filter as desired but even without doing it your eyes will likely be drawn to the big red circle in the middle, which is the customer service. Click on Show Legend at the bottom and it’ll tell you that this means it’s a root cause, so let’s dive deeper here.
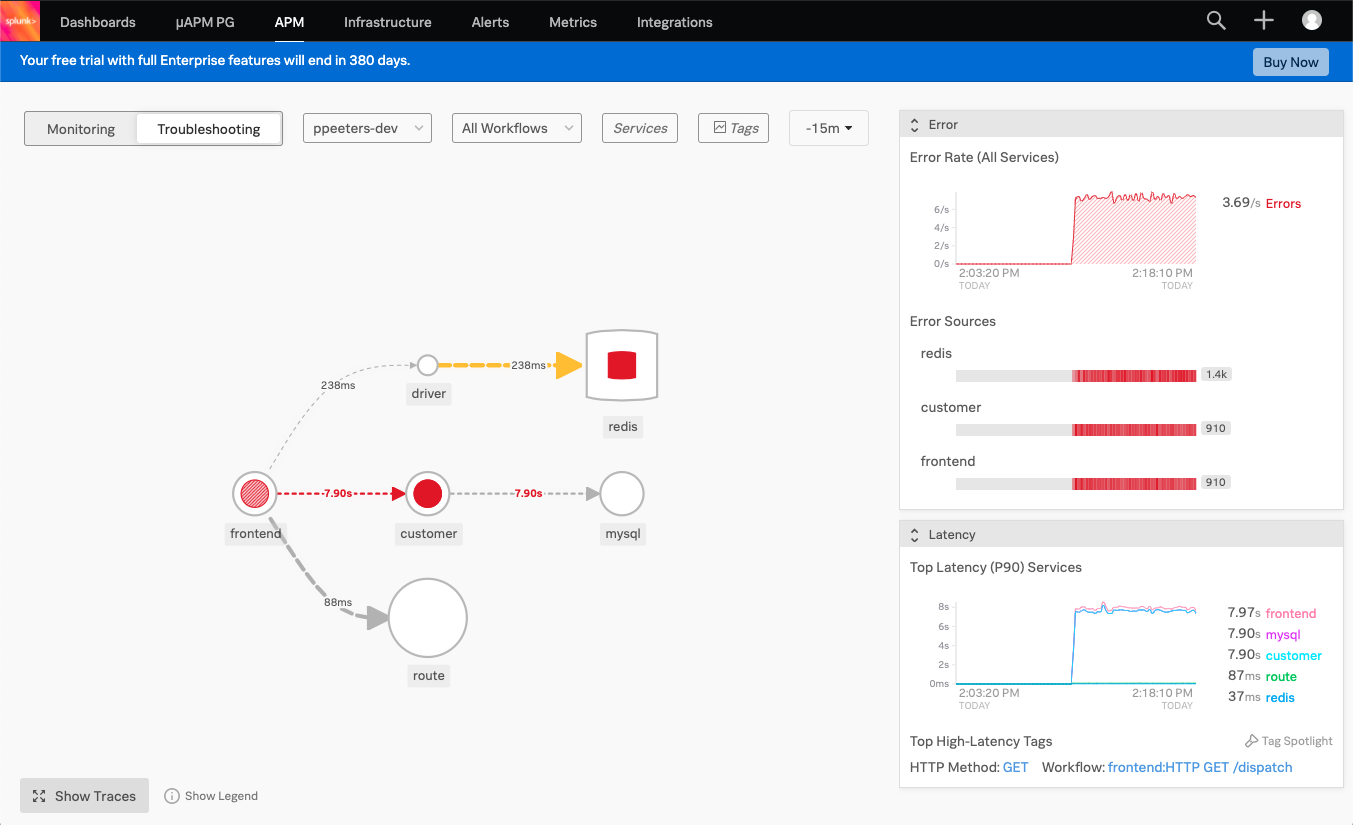
Clicking on the service you’ll see the service’s dependencies, requests & errors as well as the latency in more detail on the right-hand side.
To investigate further, click on the graph that’s showing the errors and you’ll see some traces come up. Click on one of these and all spans that are part of this trace are shown in a waterfall view.
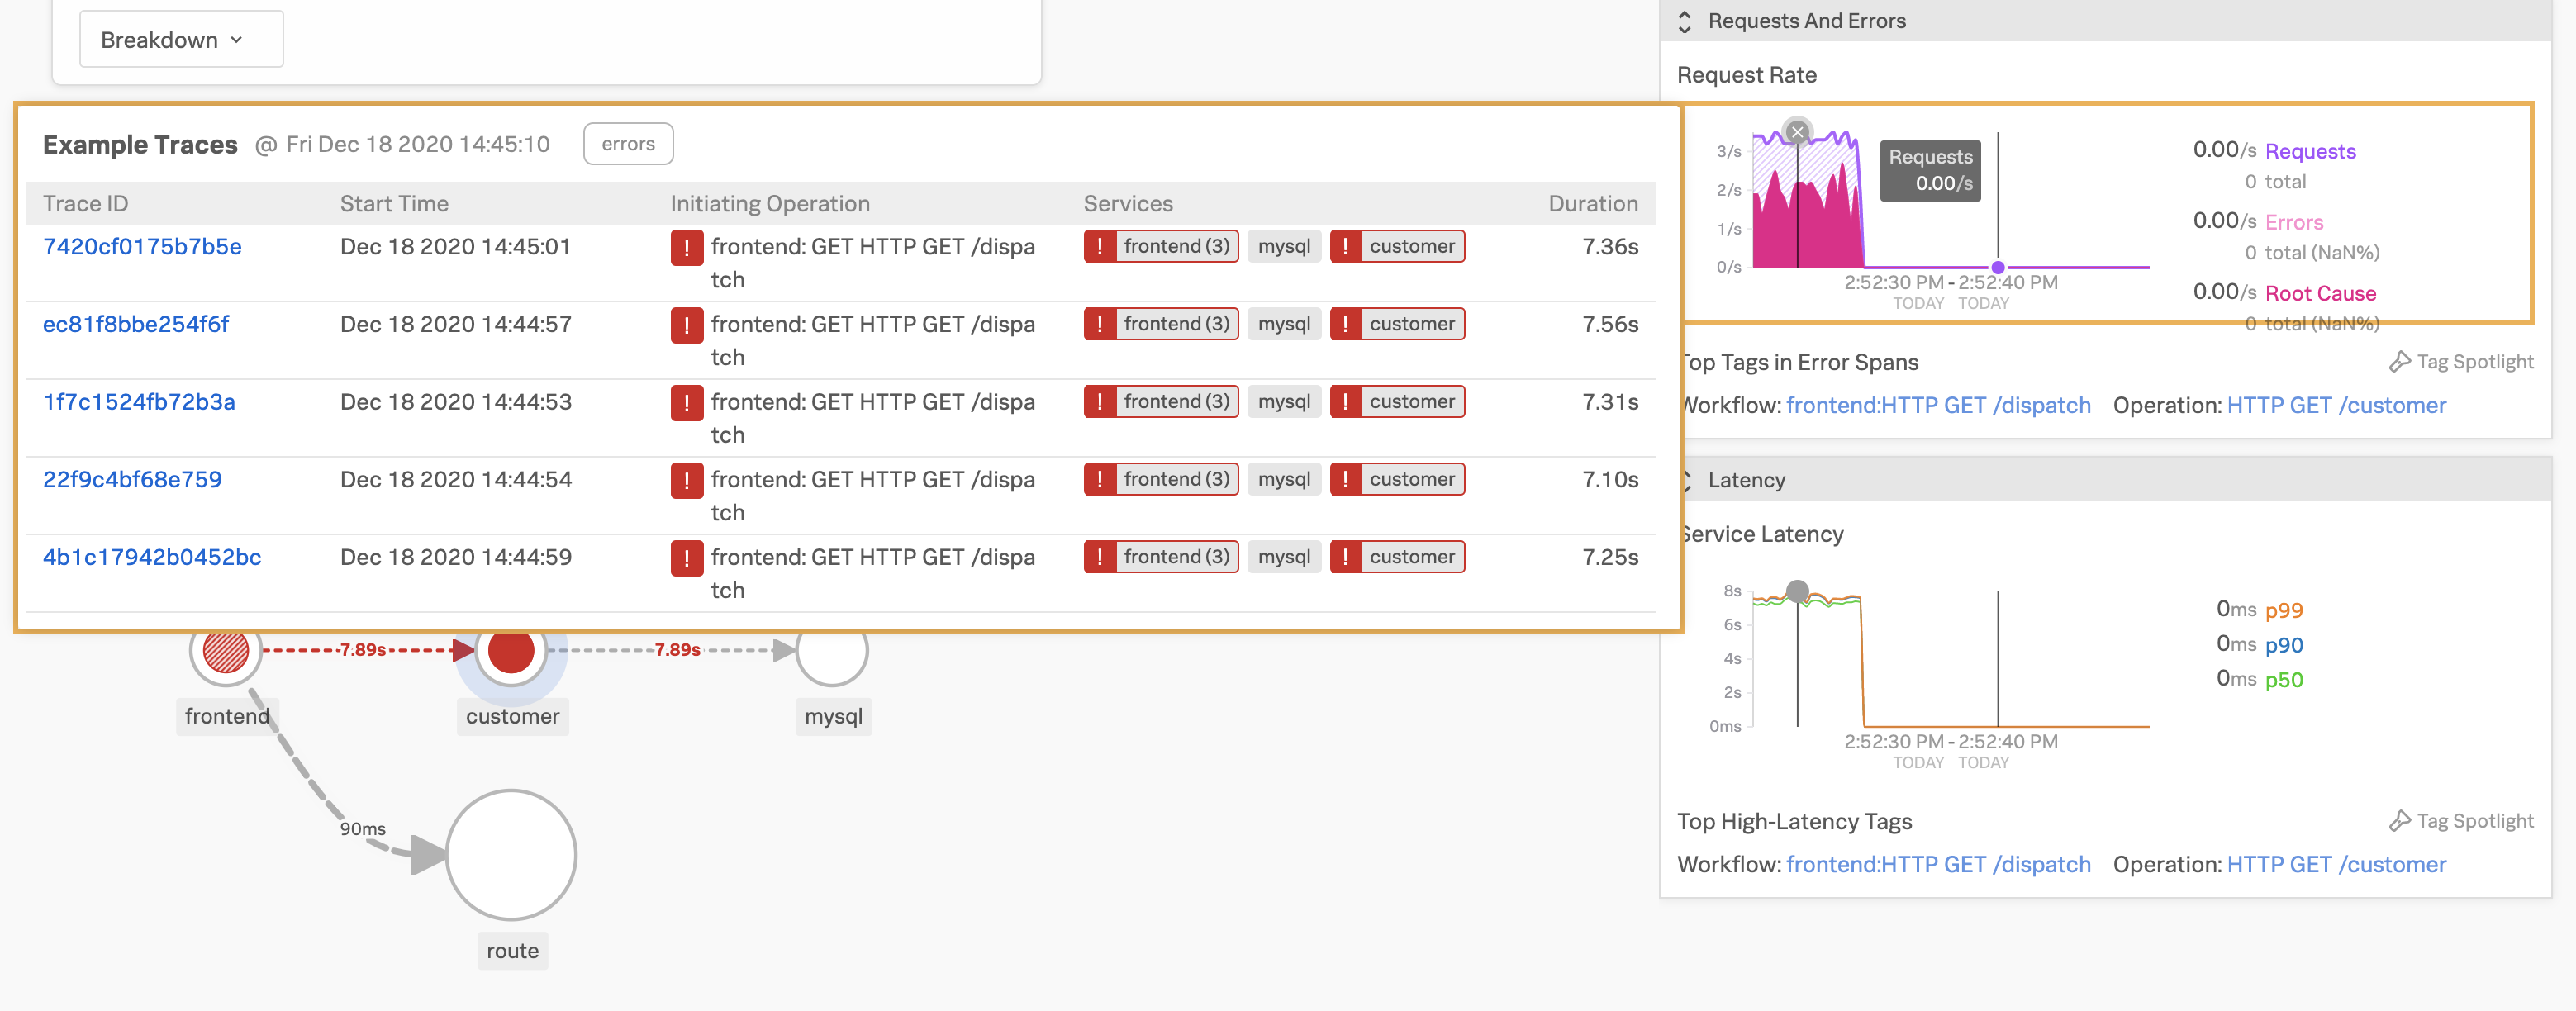
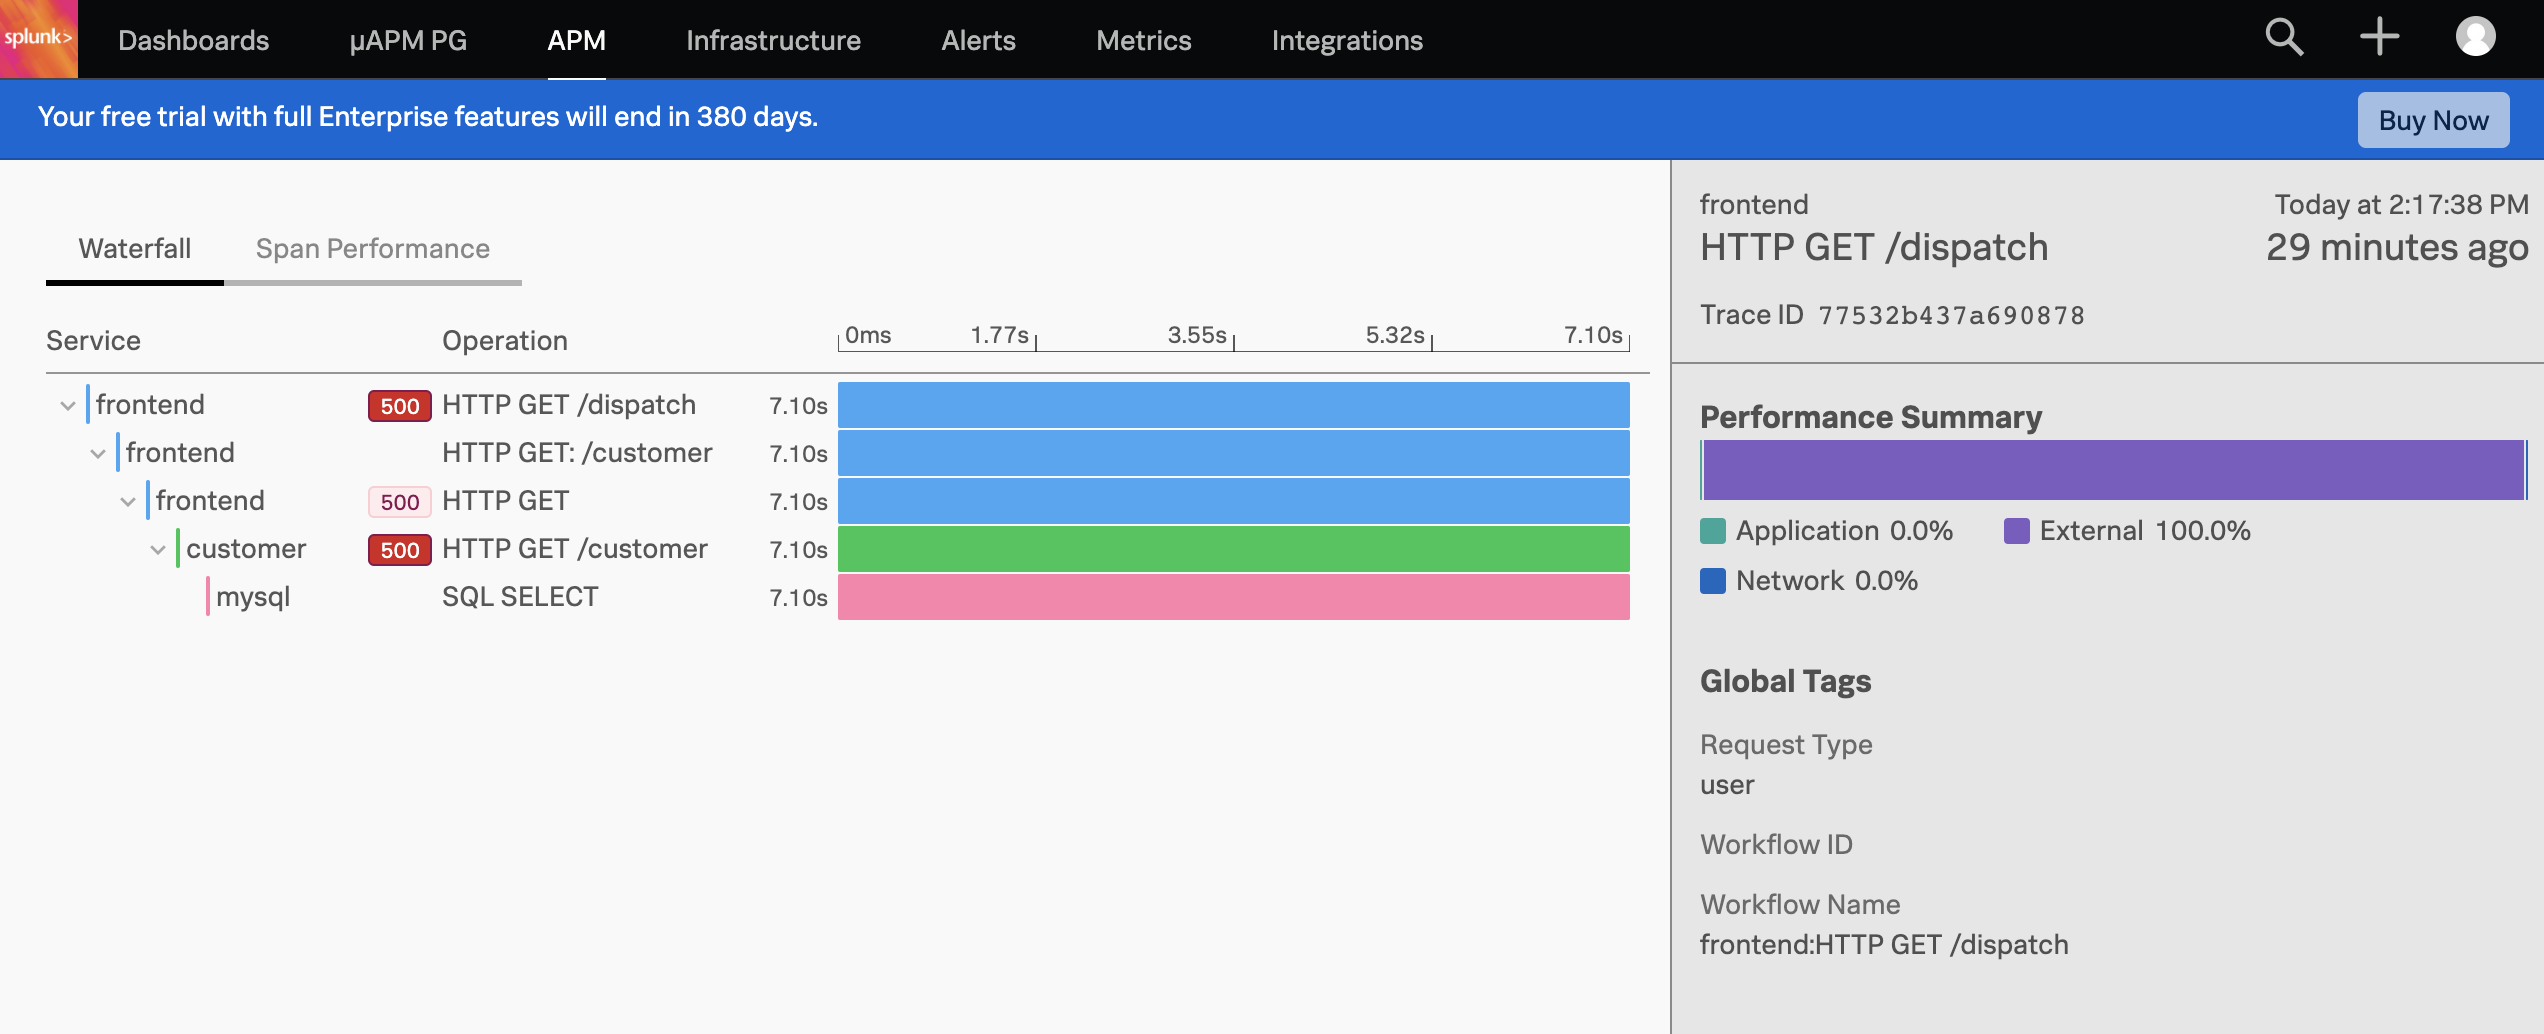
You’ll see that there have been HTTP 500 errors. Let’s click on the frontend service which expands all details from this HTTP operation - as you can see a lot of details get captured for this one request.
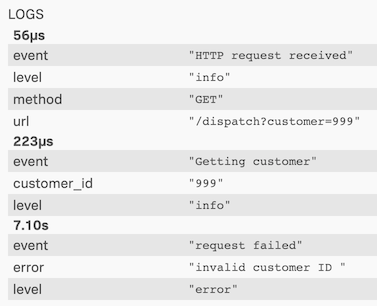
Near the bottom we can see what the culprit is, which is not surprisingly the non-existent customer ID of 999.
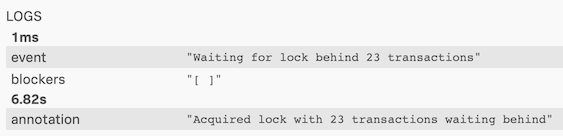
If you go to the mysql service, you can see a query is ran for this non-existent customer ID which is blocking the execution waiting for a lock for 6.82s before it was acquired. This represents an issue in the code that would need to be fixed, the blog post referenced earlier explains the scenario in more detail so I won’t go into more detail on that.
With that we’ve deployed a complete infrastructure and application in minutes, including real-time monitoring of metrics, traces and logs which we could alert on as well - well done! This was meant to be a quick blog post but turned out to be longer than anticipated…
Last but not least is to clean up after ourselves once we’re done with our lab environment is to clean it up again. That’s fortunately pretty simple: just run terraform destroy from the same directory that you ran terraform apply from and after confirmation the AWS Spot Instance will be terminated as well as the Security Group removed.